On July 15, 2024, the Republican Party formally nominated former President Donald Trump as its presidential candidate and Ohio Senator J.D. Vance as its vice presidential candidate. I did not need to conduct any research to conclude that this was almost certainly the most significant age difference between the presidential and vice presidential nominees on a major presidential ticket (I will define “major” as a ticket representing one of the two most significant national parties or otherwise a ticket with serious designs on competing to win the election in question, to be explained in more detail below). Mr. Trump, at 78 years of age, was slated to be the second-oldest presidential nominee in U.S. history, but he has been upgraded to the status of the oldest with the withdrawal of the incumbent president, the 81-year old Joe Biden, who at the time I started this project was the presumptive Democratic nominee after having swept through the primaries, withdrew from the race shortly after Mr. Trump accepted the Republican nomination. Mr. Trump’s running-mate, Ohio Senator J.D. Vance, turned 40 years old a couple of weeks later on August 2, 1984, making him one of the youngest vice presidential nominees in U.S. history (the youngest since Richard Nixon in 1952, to be precise). I double checked and confirmed that Messrs. Trump and Vance not only have the largest age difference between candidates on a major party presidential ticket, but also hold the record by a wide margin. This gave me an idea for a bigger project.
Introducing My Presidential Age Gap Survey Ranking Project
I thought it would be fun to conduct a survey of the age differences between candidates on major party presidential tickets going back to the 1804 election (the first election where the president and vice president were elected separately pursuant to the Twelfth Amendment to the United States Constitution). I decided to hold off on completing my project until the Democratic Convention Delegates settled on their nominees after the withdrawal of Mr. Biden. The party leadership quickly settled on Vice President Kamala Harris as the presumptive, and as of the date of the publication of the instant article, actual nominee. At 59 years of age, Ms. Harris seemed unlikely to head a ticket with a historically large age difference between her and her eventual running-mate. Sure enough, she settled on Minnesota Governor Tim Walz, who is just over eight months older than her, as her running mate, meaning the Harris-Walz ticket has one of the smallest age gaps between nominees contrary to what we are looking for in this study.
Introducing Our Helpful Resource
When I began looking into how I would go about organizing data for my project, I decided that creating such a chart would be too much of a pain. Instead, I looked to see if someone had already done the work for me in order to save me from having to do it myself. My hopes were realized when I came across an August 13, 2012 article by Eric Ostermeier titled Generation Gap: Romney-Ryan Ticket 7th Largest Age Difference in History (the article appears on Mr. Ostermeier’s website, Smart Politics).
As the title suggests, Mr. Ostermeier’s article was prompted by events in the 2012 election. Mitt Romney, who was the 2012 Republican Party nominee. I quote from the article:
A Smart Politics analysis of presidential running mates and tickets over the past 200+ years finds that the 23-year difference in age between Mitt Romney and Paul Ryan is tied for the seventh largest in history among the 124 pairs of candidates on presidential ballots who received Electoral College votes.
Mr. Romney was 65 at the time he accepted the 2012 Republican nomination for president while Mr. Ryan was 42. While Mr. Romney erred on the older side for a presidential nominee, he was actually younger than the both major party nominees in 2016 and 2020 when they were nominated (and younger than both 2020 nominees period [not clear what the difference is]). Mr. Romney’s selection of a young running-mate was not unusual. See Mr. Ostermeier’s note:
Over the last generation, the GOP has now picked three vice-presidential nominees that are among the youngest in history with Dan Quayle, Ryan, and Sarah Palin.
We can now add to this list Mr. Vance, who is just slightly younger than Mr. Quayle was when he was the Republican vice presidential nominee in 1988. Fun fact: Despite being the vice presidential nominee in 1988, Dan Quayle, who is alive and well today, is younger than both of the major presidential nominees from 2020. (To be sure though, the 1992 Democratic ticket (Bill Clinton and Al Gore), the winner of the 2000 and 2004 presidential elections (George W. Bush), and the winner of the 2008 and 2012 elections (Barack Obama) are also younger than both of the 2020 nominees and remain younger than 2024 nominee Republican Donald Trump and incumbent President Joe Biden.)
The Smart Politics article includes a comprehensive chart of the ages of the presidential and vice presidential nominees from 1804-2012 for tickets that won electoral votes as well as the age differences between the nominees on each ticket. It uses whole numbers for ages and age gaps instead of counting gaps by the day. For purpose of this article, I decided to use the Smart Politics table to list, in order from biggest gap to smallest, the 24 largest age gaps in major party tickets in presidential elections (24 in honor of 2024). However, while I will use Mr. Ostermeier’s table as a starting point, I will do a few things differently in my article.
Differences Between My Project and the Smart Politics List
First and most obviously, my survey will include the 2016, 2020, and 2024 elections, which occurred after the 2012 Smart Politics article.
Secondly, I will only list a ticket with the same two candidates once. For example, the Smart Politics table lists George H.W. Bush and Dan Quayle twice, once for their successful 1988 run and again for their unsuccessful 1992 re-election campaign. This makes sense for that list since it has a column for total age as well as age gap. However, I am only interested in age gaps and age gaps do not change.
Thirdly, the Smart Politics table “includes presidential tickets that were on the ballot and received Electoral College votes.” I am adopting a slightly narrower and more subjective definition. In general, I will include all major party tickets (Democratic-Republicans and Federalists from 1804-1824, Democrats and Whigs from 1828-1850, and Democrats and Republicans from 1854-2024). There are a few unusual cases – namely 1812 (no Federalist ticket but a Democrat-Republican ran as the de facto Federalist candidate), 1824 (four Democratic-Republican nominees), 1836 (four Whig nominees), 1860 (two Democratic nominees and one third-party nominee), and 1872 (no Democratic nominee, Democrats endorsed the Liberal Republican nominee), but it generally works well. I ended up only excluding one ticket that would have made the top-24 age gap list: the Progressive ticket of Robert La Follette and Burton Wheeler (1924). I provide a detailed explanation after my chart. (The Anti-Masonic ticket of William Wirt and Amos Ellmaker (1832) would have been excluded as well, but it would have been a few spots outside the top-24 in any event).
There are a few cases, including from 1824, 1836, and 1860, where I will not include every single candidate who carried a State. Notably, I will exclude two tickets, Robert La Follette/Burton Wheeler (1924) and William Wirt/Amos Ellmaker (1832), which are included on the Smart Politics list and would have made my age gaps list had I included them. My reasoning in both cases is that while these tickets each won one State, neither were nationally competitive in the sense that they were meaningfully trying to win the presidential election. I will make a note of similar edge cases after presenting my table.
Finally, I will count age gaps by the day – calculating the difference between the birthdays of the presidential and vice presidential nominees on each ticket. Thus, my shorter list will be more precise than the Smart Politics list.
Because I am an American, I will use the mm/dd/yyyy format for listing candidate birth dates. For each ticket, I will make the older member of the ticket bold so we can easily glean whether tickets with large age gaps tend to have an older presidential or vice presidential nominee.
My Date Calculator
I used Qcalculate!, a free and open source cross-platform desktop calculator application, to calculate the differences between dates.
24 Major Presidential Tickets With The Largest Age Gaps
(Election years in bold indicates that the ticket in that column won the election. Older candidates on each ticket are in bold.)
| # | Elex | Party | Presidential Candiate | DOB | V. Presidential Candidate | DOB | Age Gap |
|---|---|---|---|---|---|---|---|
| 1 | 2024 | R | Donald Trump | 06/14/1946 | J.D. Vance | 08/02/1984 | 13929 |
| 2 | 1856 | D | James Buchanan | 04/23/1791 | John Breckinridge | 01/16/1821 | 10860 |
| 3 | 1904 | D | Alton Parker | 05/14/1852 | Henry Davis | 11/16/1823 | 10407 |
| 4 | 2008 | R | John McCain | 08/29/1936 | Sarah Palin | 02/11/1964 | 10027 |
| 5 | 1900 | D | William J. Bryan | 03/19/1860 | Adlai Stevenson I | 10/23/1835 | 8914 |
| 6 | 1896 | D | William J. Bryan | 03/19/1860 | Arthur Sewall | 11/25/1835 | 8881 |
| 7 | 1888 | D | Grover Cleveland | 03/18/1837 | Allen G. Thurman | 11/13/1813 | 8526 |
| 8 | 2012 | R | Mitt Romney | 03/12/1947 | Paul Ryan | 01/29/1970 | 8359 |
| 9 | 1988 & 1992 | R | George H.W. Bush | 06/12/1924 | Dan Quayle | 02/04/1947 | 8272 |
| 10 | 1952 & 1956 | R | Dwight Eisenhower | 10/14/1890 | Richard Nixon | 01/09/1913 | 8122 |
| 11 | 2020 | D | Joe Biden | 11/20/1942 | Kamala Harris | 10/20/1964 | 8005 |
| 12 | 1836 | W[n1] | William H. Harrison | 02/09/1773 | Francis Granger | 12/01/1792 | 7235 |
| 13 | 1812 | DR/F[n2] | DeWitt Clinton | 03/02/1769 | Jared Ingersoll | 10/24/1749 | 7069 |
| 14 | 1860 | SD[n3] | John Breckinridge | 01/16/1821 | Joseph Lane | 12/14/1801 | 6973 |
| 15 | 2008 & 2012 | D | Barack Obama | 08/04/1861 | Joe Biden | 11/20/1942 | 6832 |
| 16 | 1852 | D | Franklin Pierce | 11/23/1804 | William R. King | 04/07/1786 | 6804 |
| 17 | 1852 | W | Winfield Scott | 06/13/1786 | William A. Graham | 09/05/1804 | 6658 |
| 18 | 1940 | R | Wendell Wilkie | 02/18/1892 | Charles L. McNary | 06/12/1874 | 6460 |
| 19 | 1884 | D | Grover Cleveland | 03/18/1837 | Thomas A. Hendricks | 09/07/1819 | 6402 |
| 20 | 1840 | W | William H. Harrison | 02/09/1773 | John Tyler | 03/29/1790 | 6257 |
| 21 | 1836 | W[n3] | Hugh White | 10/30/1773 | John Tyler | 03/29/1790 | 6209 |
| 22 | 1816 & 1820 | DR | James Monroe | 04/28/1758 | Daniel D. Tompkins | 06/21/1774 | 5859 |
| 23 | 1900 | R | William McKinley | 01/29/1843 | Theodore Roosevelt | 10/27/1858 | 5750 |
| 24 | 1832 | D | Andrew Jackson | 03/15/1767 | Martin Van Buren | 12/05/1782 | 5744 |
Notes on List
Notes: [n1] The Whig Party opted for a cute strategy in 1860 wherein they nominated two presidential candidates, William Henry Harrison and Hugh L. White, and additionally ran two “favorite son” candidates in individual states. I counted the two main Whig tickets and both made our list at positions 12 and 21 (I would not have counted the “favorite son” tickets – but that ended up being moot). As for the strategy – the goal was to hold the Democratic nominee, Martin Van Buren, below half of the total Electoral Votes and force the election to go to the U.S. House of Representatives. The strategy came a couple thousand votes in Pennsylvania away from working, but alas for the Whigs, they would have to wait four years for their electoral triumph. [n2] DeWitt Clinton led a de facto Federalist ticket in 1812, and his running-mate, Jarden Ingersoll, was a Federalist. However, the Federalists did not produce a nominee and Clinton remained a Democratic-Republican. [n3] The Democratic Party split in two in 1860, with main Democratic Convention nominating Stephen A. Douglas and Southern Democrats nominating John Breckinridge. Breckinridge finished second in the election behind the winner, Abraham Lincoln.
Finally, before continuing, I note again that I omitted one high-ranking ticket from the Smart Politics ticket – the 1924 Progressive Ticket of Robert La Follette and Burton Wheeler. They took 16% of the vote (not too far behind the Democratic ticket, which won 28% of the vote) and carried La Follette’s home state of Wisconsin. La Follette had actually sought the Republican nomination against New Leaf Journal regular John Calvin Coolidge, who was the incumbent president at the time (and eventual landslide winner of the election) before running on the Progressive ticket. I omitted La Follette, despite his relatively strong showing for a third party candidate, because he did not have a meaningful path to winning the election (to be sure, neither did the Democratic nominee – Coolidge’s victory was correctly seen as a foregone conclusion for a well before the votes were cast), and LaFollette was only meaningfully competitive in a small number of states outside of his home state of Wisconsin. However, if you were to count the LaFollette/Wheeler ticket, La Follette, who was born on June 14, 1855, was 9755 days older than his running-mate, Burton K. Wheeler, who was born on February 27, 1882, the ticket would have come in at sixth place on our list.
Analysis
Below, I will discuss some interesting points that jumped out to me from our top-24.
Wins and Losses
Perhaps the most interesting thing to examine is whether these age-gap tickets were largely successful. First, I decided to consider only the first election these tickets ran since re-election campaigns benefit from incumbency. Secondly, I will consolidate the two Whig 1836 tickets on our list since the party’s purpose was to ensure that they forced the election to the House where one of them (likely Harrison) could prevail. Thirdly, Trump-Vance will obviously not count since the 2024 election is in progress.
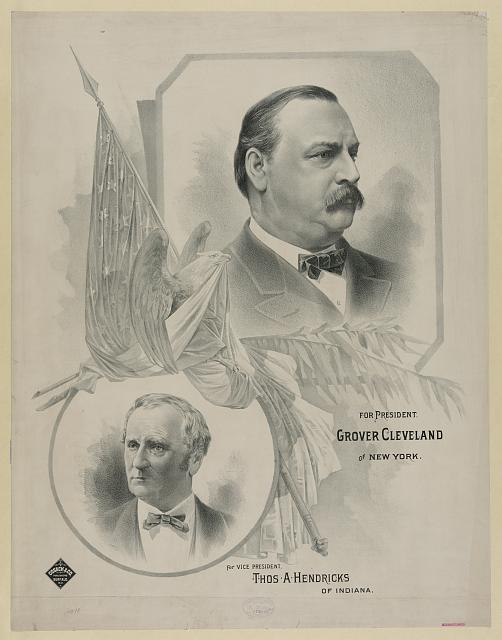
Source: Cosack & Co., Lithographer. For president Grover Cleveland, of New York – for vice president Thos. A. Hendricks, of Indiana. , ca. 1884. Buffalo, N.Y.: Cosack & Co., Publishers, July 24. Photograph. https://www.loc.gov/item/2012647278/.
Excluding all cases when the same ticket ran for reelection and consolidating the 1836 tickets, the big age gap tickets won 11 out of 22 elections (Biden 2020, Buchanan 1856, Bush 1988, Cleveland 1884, Eisenhower 1952, W. Harrison 1840, Jackson 1832, McKinely 1900, Monroe 1816, Obama 2008, and Pierce 1852). If we are interested in age-gap tickets vs non-age-gap tickets, we should also exclude 1852, 1900, 2008, and 2012 (2012 not listed above since Obama/Biden was running for re-election) since those elections were contested by two tickets that make our top-24 age-gap list. One could make the case for excluding Jackson in 1832 and and Cleveland in 1888 since they, along with the previously excluded McKinley-Roosevelt ticket from 1900, were incumbent presidents running with new running-mates. If we exclude just the elections that were contested entirely between big age-gap tickets, we are left with 8 winners and 8 losers. One could make a case for excluding Jackson (1832) and Cleveland (1888) since those were incumbent presidents running with new running mates (McKinley fits the same bill for 1900, but his ticket was running against another high age-gap ticket), but Jackson won and Cleveland lost, so that would not change the final ratio.
Having excluded age gap tickets that ran together more than once in their second runs, we can take a look at how they did in multiple elections. Monroe/Tompkins (1812 and 1816), Eisenhower/Nixon (1952 and 1956) and Obama/Biden (2008 and 2012) won twice while Bush/Quayle won in 1988 but lost in 1992.
Regarding re-elections, we have an interesting list trend wherein a number of successful tickets did not return to seek re-election. I noted Jackson (1832), Cleveland (1888), and McKinley (1900) sought re-election with new running-mates, and of these, Cleveland had headed a big age-gap ticket in 1884. Beginning from the largest age-gap tickets, James Buchanan did not seek re-election in 1860 after winning in 1856 (his Vice President, John Breckinridge, ran for president), Biden/Harris did not seek re-election in 2024 on account of the late withdrawal of Mr. Biden, Franklin Pierce was not re-nominated by the Democrats in 1856 after being elected in 1852, and William Henry Harrison did not seek re-election in 1844 having died shortly after being sworn in in 1881. Thus, five of the big age-gap tickets that won the presidency with a non-incumbent did not return in the same form to seek re-election four years later.
These statistics do not suggest that having a significant age gap between the head of the ticket and the running-mate makes a big difference in a general sense. It is worth noting that a few of the losing tickets were chosen in an environment where their party’s had little hope of winning the election (tickets headed by Scott in 1852 and Parker in 1904 are good examples). I did notice that we have more winning tickets at the bottom of our top-24 than at the top (pending the final results of 2024 for the top-top difference), but I see no reason to attribute the difference to there being slightly less significant age differences at the bottom-end of our big age difference ranking.
Recent Trends
Four of the five most recent elections have featured at least one of the 24-largest age-gap tickets. Both tickets made the list in 2008 and 2012 (Obama/Biden in both elections) and one in 2020 (Biden/Harris) and 2024 (Trump/Vance). 2016 featured older heads of the ticket, with Mr. Trump becoming (for four years) the oldest first-term president in U.S. history while his opponent, Hillary Clinton, would have been the second-oldest (behind Reagan), but both picked running mates who were old enough to keep the tickets off the age-gap list. Readers will also note that the Bush/Quayle tickets in 1988 and 1992 are ninth on our list – so there is a definite recent age-gap trend.
Older Top or Bottom of Ticket
I guessed going in that more of our age-gap tickets would feature an older presidential candidate than vice presidential candidate, and that turned out to be the case by a margin of 14-10. But the trend favoring older presidential candidates is recent. We have seven unique tickets on the list (by “unique tickets” I mean excluding re-election campaigns, for example Obama-Biden only counts once since it was the same ticket in two separate elections) starting with the 1952 election and six of these have featured an older presidential candidate than vice presidential candidate (Obama/Biden 2008 and 2012 being the exceptions). Prior to that, 9 of the 17 tickets had an older vice presidential candidate – driven in large part by some losing tickets around the turn of the 20th century.
Looking at the full list of big age-gap tickets that won their elections, 8 out of 11 had an older presidential candidate than running-mate.
Candidates Appearing on More than One Ticket
A few individuals appear in our top-24 as part of multiple tickets.
- John Breckinridge is part of the second-place 1856 ticket as running mate and then headed the 14th place ticket in 1860. Breckinridge was a shade over 36 years of age when he was sworn in as Vice President on March 4, 1857, making him the youngest Vice President or President in U.S. history. (In 1865, Breckinridge became the fifth, final, and youngest Secretary of War of the Confederate States of America..)
- William Jennings Bryan headed consecutive tickets that made our list at 5th (1900) and 4th (1896). Bryan was the youngest major party nominee in U.S. history in 1896 (he was 36 during the election).
- Grover Cleveland makes the list twice. His losing 1888 re-election bid featured a new (74-year old) running mate, which made the list at 7th. His initial winning campaign in 1884 comes in at 19th. Cleveland’s third campaign, wherein he regained the presidency in a re-match against Benjamin Harrison (I discussed Harrison’s 1888 campaign in an article), did not make our top-24. Cleveland, Andrew Jackson, Franklin Roosevelt, and Donald Trump are the only individuals to head a major party ticket in at least three consecutive elections.
- Joe Biden comes in at 11th as head of the 2020 ticket and at 15th for being the running-mate in 2008 and 2012.
- William Henry Harrison headed the 12th place ticket (1836) and the successful 20th place ticket (1840). Harrison was the oldest first-term president until Ronald Reagan (not on our age-gap list as evinced for the fact that his Vice President, George H.W. Bush, was old enough to make our list heading a ticket to succeed Reagan) was sworn in on January 20, 1981. That mark was since surpassed successively by Messrs. Trump and Biden in 2017 and 2021.
- Finally, John Tyler makes the list twice as a Whig running-mate, first in 1836 with Hugh White and more successfully with William Henry Harrison (“Tippecanoe and Tyler Too!”) in 1840. As I noted in the previous bullet, Harrison also ran for president in 1836, but with a different running-mate. Despite the tickets being separated by 9 spots in our ranking, Harrison was only just a shade under 9 months older than White.
- Andrew Jackson would have made this list twice prior to 2012. He ran with John C. Calhoun as his running make in 1824 and 1828 and their 5482 age gap (Jackson being older) would have been 27th on our ranking. Not far behind would have been John Quincy Adams and Calhoun in 1824 (Calhoun was running-mate for both Adams and Jackson in the 1824 election, but only for Jackson in the 1828 rematch) since Adams was just a few months younger than Jackson.
Extremes
Our list features the three oldest major party nominees ever, headed by 1904 vice presidential nominee Henry Davis (who keeps the distinction of being the oldest person to appear on a ticket as a result of Mr. Biden’s withdrawal in 2024), Mr. Trump (2024), and Mr. Biden (2020). It also features a number of the youngest nominees, namely Tompkins in 1812 and 1816, Bryan in 1896 and 1900, Breckinridge in 1856 and 1960, Roosevelt in 1900, Nixon in 1952, Quayle in 1992, and Vance in 2024. I do think the list broadly favors extremely young nominees over older ones because tickets with two older-than-average candidates are more common than tickets with two very young candidates. But this rule is not absolute. John Kennedy holds the record for youngest presidential election winner (1960), but his running mate, Lyndon B. Johnson was only about nine years older. Bill Clinton (1992) was the second youngest election-winner, but he was just over a year-and-a-half older than his running-mate, Al Gore (Gore was the seventh youngest Vice President – the five youngest, Breckinridge, Nixon, Quayle, Theodore Roosevelt, and Tompkins were all part of tickets in our top-24 and the sixth youngest, John C. Calhoun, narrowly missed the list). In the older candidate list, all picked old enough running-mates to comfortably miss our top-24. This includes recent tickets headed by Ronald Reagan in 1980-84 (third-oldest presidential election winner), Bob Dole in 1996 (Dole would have been 73 when sworn in had he won), Donald Trump in 2016 and 2020 (Mr. Trump was the oldest first-term president, since surpassed by Mr. Biden), and Hillary Clinton in 2016 (Ms. Clinton would have been the second oldest person to be elected to the presidency behind Reagan had she won in 2016). In the case of Reagan, this should be no surprise since he was succeeded by his Vice President, George H.W. Bush, who was old enough to head the ticket with he ninth largest age-gap.
Conclusion
Mr. Trump’s selection of the much younger J.D. Vance as his running-mate inspired an fun project. But what can we take away from the results. My take: Not too much. The prevailing wisdom that few presidential elections are tipped by running mates is largely true, notwithstanding the fact that a few recent elections (2020, 2016, and 2000; or going a little bit further back, 1960) were close enough that one could argue the running-mate, along with other ordinarily non-decisive factors, swung the result in one decisive state or another. But even if you can make the case that the running-mate may have swung the result in a close election, I cannot identify an election where one could plausibly argue that the age difference between the top of the ticket and the running-mate meaningfully contributed to the final election result.
I thought about collecting all of the ticket age differences – and I may do that for a future project — but for the purpose of a self-contained article, I think limiting our selection to the 24-biggest age gaps is the best approach.